Introduction
In financial trading, understanding how different assets are connected is very important. Correlation is a key concept that helps traders see these connections. It’s a way of measuring how the prices of two assets move in relation to each other. Correlation tells us if two assets usually move in the same direction, or if one tends to go up when the other goes down.
This blog explores what correlation means, how it works, why it’s important for managing risk, and how traders can use it to improve their strategies.
What Does Correlation Mean?
Correlation is quantified by a numerical value that falls within the range of -1 to +1. This scale displays the correlation’s direction and intensity between two assets:
+1 (Perfect positive correlation) signifies that both assets consistently move in the same direction. If Asset A rises by 10%, Asset B also rises by 10%.
-1 (Perfect negative correlation): Shows that two assets move in completely opposite directions. In the event that Asset A goes up by 10%, Asset B will go down by 10%.
0 (No correlation): Indicates that there is no uniform connection between the movements of two assets.
Correlation can also be represented as a percentage, with values falling between +100% and -100%. A stronger positive percentage signifies a robust positive correlation, whereas a lower percentage denotes a strong negative correlation.
Here’s a breakdown of correlation percentages for weak, moderate, strong, and very strong relationships:
• Weak correlation: ±0% to ±30%
• Moderate correlation: ±30% to ±60%
• Strong correlation: ±60% to ±80%
• Very strong correlation: ±80% to ±100%
These ranges help indicate the strength of the correlation between two variables, with values closer to ±100% showing a stronger relationship.
What is The Significance Of Correlation?
Traders must comprehend correlation for various purposes, such as risk management, hedging strategies, and portfolio diversification. By understanding the way assets interact with each other, traders can prevent excessive exposure to one risk factor and create a diversified portfolio.
Types of Correlation
Positive correlation happens when two assets move in the same direction. An instance of this is when gold (XAU/USD) and silver (XAG/USD) tend to show a positive relationship due to their classification as precious metals. Scenario: If you anticipate a rise in gold prices and aim to maximize your earnings, investing in both gold and silver could enhance profits because of their strong relationship.
Negative correlation happens when two assets go in opposite directions. An illustration is the strong negative correlation between EUR/USD and USD/CHF. When the Euro gains strength relative to the dollar, the dollar usually loses strength in relation to the Swiss franc. Scenario: Traders have the option to utilize pairs that are negatively correlated for the purpose of hedging. For example, holding a long position in EUR/USD and a short position in USD/CHF can lower your total risk.
No correlation is present when two assets do not have a notable connection and their movements are not dependent on each other. Application scenario: Perfect for expanding investments to distribute risk among different markets.
Correlation Matrix
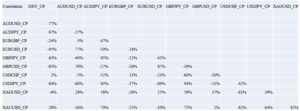
This method is an excellent approach for visualizing and understanding the correlation between multiple currency pairs. In our analysis, using data from Investing.com for the period between January 1, 2019, and September 14, 2024, we employed a matrix layout to illustrate the relationships among various currency pairs based on different price benchmarks, including opening price, closing price, high, and low. A simplified version of the correlation matrix, focusing on closing prices, highlights the relationships between major currency pairs.
Major Currency pairs correlations are noted in below correlation matrix table:

EUR/USD vs. DXY: -95% (Very strong negative correlation),
GBP/JPY vs. AUD/JPY: +95% (Very strong positive correlation),
XAU/USD vs. XAG/USD: +85% (Very strong positive correlation),
GBP/USD vs. DXY: -83% (Very strong negative correlation),
GBP/USD vs. EUR/USD: +87% (Very strong negative correlation)
LIVE EXAMPLES
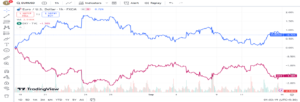
EUR/USD and DXY
This major pair demonstrates a significant negative correlation of -95%. The US Dollar Index (DXY) assesses the worth of the US dollar in comparison to a collection of international currencies. When the Euro strengthens against the Dollar, the EUR/USD pair (shown in blue) typically rises, while the DXY index (shown in purple) generally decreases.

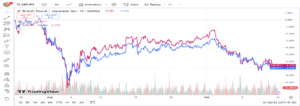
GBP/JPY and AUD/JPY
With a correlation of +95%, these pairs typically move in sync with each other. Both GBP/JPY (shown in blue) and AUD/JPY (shown in purple) are seen as pairs that are influenced by risk factors. In times of optimism in the global market (risk-on sentiment), both pairs typically experience an increase.

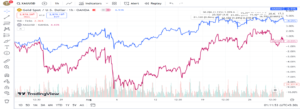
XAU/USD and XAG/USD
XAU/USD (shown in blue) and XAG/USD (shown in purple) typically move in conjunction due to their high correlation of +85%. Due to being perceived as safe haven, both metals display a significant positive relationship due to similar supply and demand dynamics.

Importance of Correlation in Risk Management in Trading
1. Trading several pairs with high correlation can increase risk instead of spreading it out. Trading both EUR/USD and GBP/USD at the same time because of their 87% positive correlation, can result in comparable losses if the market goes against your trades.
2. Hedging strategies involve traders utilizing pairs that are negatively correlated. For example, if a trader has a buy position on EUR/USD, placing a sell position on USD/CHF can help reduce risk as a decrease in one pair will probably be balanced out by an increase in the other.
3. Prevent Over-Concentration: A portfolio with assets that are highly correlated can result in over-concentration and higher susceptibility to market changes. Considering correlation is crucial for achieving diversification and preventing unforeseen fluctuations in a portfolio.
4. Correlations can vary as they are affected by economic events, interest rate fluctuations, or changes in market sentiment, thus showing their dynamic nature. It is important to consistently monitor these changes in order to adapt trading strategies as needed.
Application in Practice
To demonstrate the concept, let’s analyse 2 trading situations.
Situation 1: Trading pairs with high correlation
Assume a trader has a positive outlook on the Euro and buys EUR/USD and GBP/USD. In the event of a Euro depreciation, both positions could incur substantial losses because of the strong correlation between the pairs. The trader is essentially increasing their risk by two times unknowingly.
Situation 2: Employing Negative Correlation in hedging
An investor goes long on EUR/USD and concurrently goes short on USD/CHF. With a correlation of -95%, a decrease in the Euro compared to the Dollar could be balanced out by an increase in the Dollar against the Swiss Franc in the EUR/USD and USD/CHF exchange rates.
Recommendations For Traders
Understanding correlation is essential for constructing successful trading strategies. Therefore, it is important to conclude and provide recommendations on this matter. No matter if you are new or skilled in trading, adding correlation analysis to your strategy can reduce risks and improve profits.
Here are some important points to remember:
✔ Keep an eye on correlation on a regular basis because it can change, so update your analysis often.
✔ Strategically diversify by avoiding trading multiple pairs that are highly correlated to minimize exposure to the same risk factor.
✔ Utilize correlation as a strategy for managing risk.
✔ Think about utilizing pairs of assets that move in opposite directions to protect your investments and manage the overall risk in your portfolio.
✔ By leveraging the power of correlation, traders can navigate the complexities of the financial markets more effectively, enhancing their ability to build resilient trading strategies.
Written By-

TATHAGAT BEHERA
BBA Finance
SOA University, Bhubaneswar
Capital Market Analyst Intern

