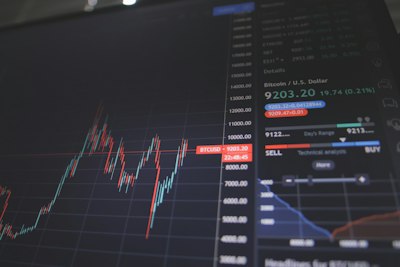
What is Price Action Trading?
Price action trading is a methodology that relies solely on the analysis of raw price movements to make trading decisions. Unlike indicator-based strategies that lag behind price, price action traders read the market in real-time, identifying opportunities as they develop.
The beauty of price action lies in its simplicity. You don't need complex indicators or sophisticated software. All you need is a clean chart and the knowledge to interpret what price is telling you.
Why Professional Traders Prefer Price Action
After years of mentoring traders, I've noticed that the most successful ones eventually gravitate toward price action. Here's why:
1. No Lag
Indicators are derived from price, which means they're always playing catch-up. Price action gives you the information first-hand, allowing you to enter trades earlier and with better risk-reward ratios.
2. Works Across All Markets
Whether you're trading forex, stocks, crypto, or commodities, price action principles remain constant. Supply and demand dynamics don't change based on the asset class.
3. Builds True Market Understanding
When you trade price action, you develop an intuitive understanding of market psychology. You start to see the battle between buyers and sellers, the accumulation and distribution phases, and the emotions driving market movements.
Essential Price Action Concepts
Support and Resistance
These are the foundational building blocks of price action. Support is a price level where buying interest is strong enough to prevent further decline. Resistance is where selling pressure prevents further advance.
The key insight here is that these levels are not exact prices but rather zones where price tends to react. A support zone broken becomes resistance, and vice versa – this is the polarity principle.
Candlestick Patterns
Single candlesticks tell a story of the battle between buyers and sellers within a specific timeframe. Key patterns to master include:
- Pin Bars: Long wicks showing rejection of a price level
- Engulfing Patterns: Momentum shifts signaled by a candle completely engulfing the previous one
- Inside Bars: Consolidation patterns that often precede breakouts
- Doji Candles: Indecision in the market, often at turning points
Market Structure
Understanding market structure means recognizing the sequence of higher highs and higher lows (uptrend) or lower highs and lower lows (downtrend). Trend changes occur when this sequence breaks.
Putting It All Together
The magic happens when you combine these elements. Look for:
1. Key support/resistance levels on higher timeframes
2. Price action signals (candlestick patterns) at these levels
3. Market structure confirmation
4. Optimal entry with clear stop-loss placement
Common Mistakes to Avoid
- Over-complicating: Keep your charts clean. Too many lines and levels create confusion.
- Ignoring context: A pin bar means nothing without the right context (key level, trend direction).
- Not waiting for confirmation: Patience is crucial. Don't anticipate signals; wait for them to form.
- Poor risk management: Even the best setups fail. Always use proper position sizing.
Your Next Steps
Start by practicing on higher timeframes (daily, 4-hour) where patterns are cleaner. Keep a trading journal documenting every setup you identify, whether you trade it or not. Over time, you'll develop pattern recognition skills that become second nature.
Remember, price action mastery is a journey, not a destination. Even after years of trading, I continue to learn new nuances about how price behaves. Stay curious, stay humble, and most importantly, stay consistent with your practice.